How to Forecast Event Staff Demand
August 10, 2026

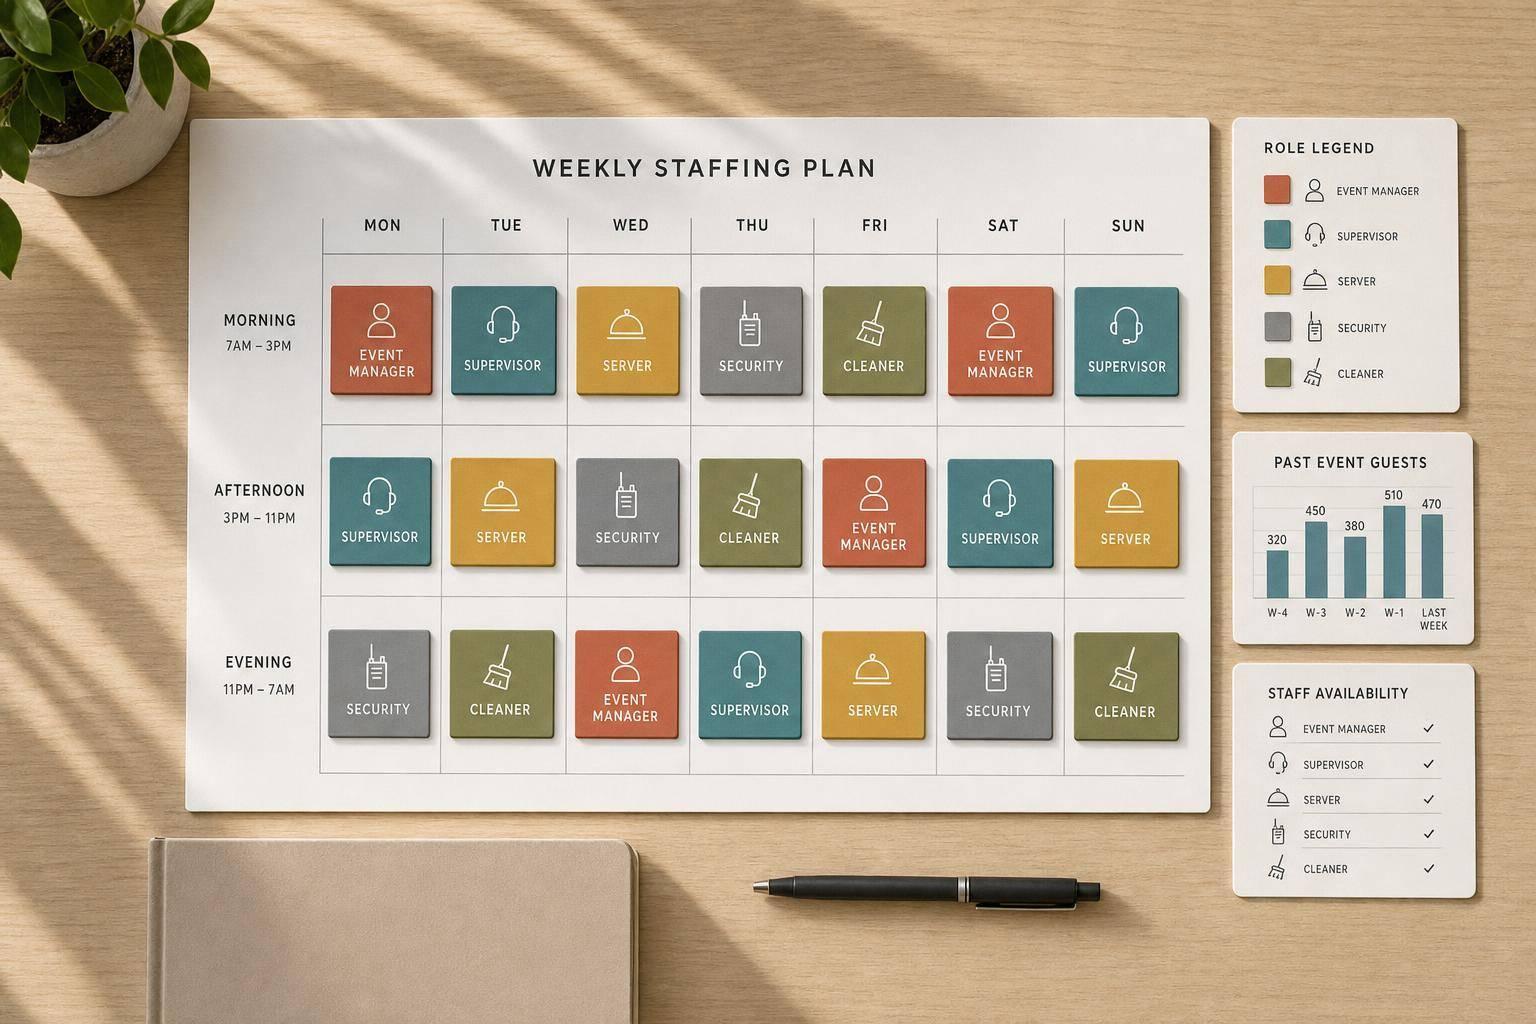
If your staffing forecast is off, service slips fast and labor costs can jump just as fast. I’d keep it simple: use event details, guest count, past event data, and staff availability to estimate roles, headcount, and shift hours before the week gets busy.
Here’s the core idea in plain English:
A few numbers stand out:
What matters most is this: forecasting is not just planning one event. It’s a weekly system for spotting shortages early, setting shift times around busy windows, and turning rough booking info into a roster you can use.
If I had to boil the full process down, it would look like this:
That’s the whole job: know what’s coming, know who you have, and match the two before event day turns into a scramble.
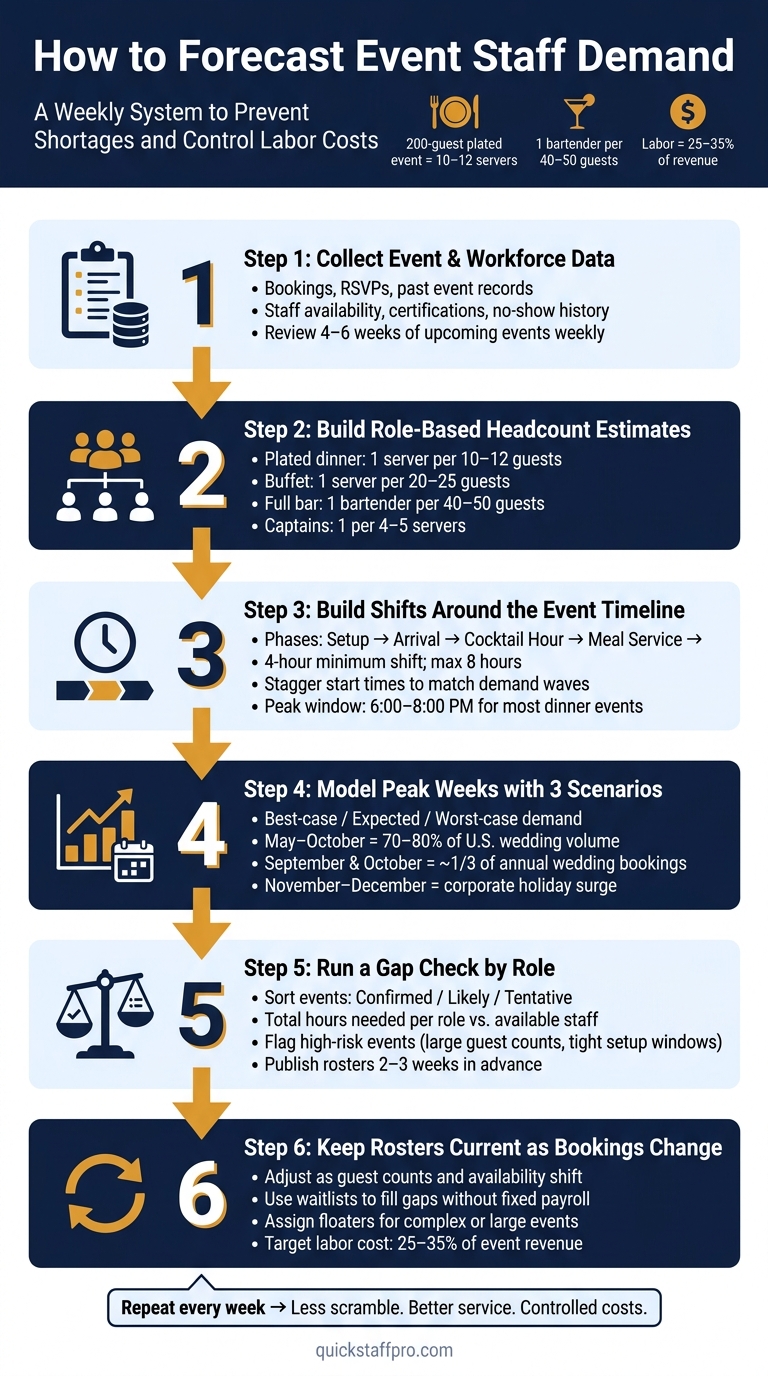
How to Forecast Event Staff Demand: 6-Step System
Start with structured event records so you can spot staffing patterns fast. When your records follow the same format each time, it becomes much easier to compare bookings and reuse what you learn.
For every event you book, record the same core fields in the same format. That consistency lets you compare one event with another over time. At a minimum, each record should include:
Service style can shift staffing needs more than guest count by itself. A plated dinner for 200 guests might need roughly 10–12 servers, while a buffet for that same crowd usually needs 7–8.
Once you have structured records, pull similar events and compare them side by side. Focus on planned headcount versus actual staff on site, overtime hours by role, and any service complaints that point to under- or overstaffing.
Say you look at several past indoor plated galas in the same guest-count range and see they all ran smoothly with close to the same staffing ratios. That gives you a starting point for the next similar booking. If one of those events drew complaints after bar coverage dipped, mark that too. Small warning signs like that can save you a headache later.
Try to gather at least 6–12 months of past data before you rely too much on derived ratios. Here’s how the main data sources compare when you’re building a forecast:
| Data Source | Usefulness for Forecasting | Key Insights Provided |
|---|---|---|
| Historical events | Very high | Past staffing ratios, actual vs. planned headcount, overtime trends |
| Ticket sales / RSVPs | High | Real-time guest volume, peak arrival patterns |
| Sales pipeline / bookings | Medium–high | Future volume timing, event type mix |
| Staff availability records | High | Feasibility check against forecasted demand |
Using all four sources together shows both what’s coming and whether you can staff it.
Next, compare forecasted demand with the staff you can actually assign. A forecast only helps if projected demand lines up with your available pool. If your forecast calls for more certified bartenders than you have that weekend, you’ve got a gap before the event is even on the calendar.
Keep a current record of each staff member’s role, skills, certifications, availability windows, and attendance history, including no-shows. Quickstaff centralizes availability tracking, role-based scheduling, and waitlists so you can check forecast demand against your actual staff pool and spot gaps early.
With the inputs standardized, convert them into role-by-role headcount and shift estimates.
Now turn those inputs into actual staffing numbers: how many people you need, what they’ll do, and how long they should work.
Before you assign anyone, split each event into service zones. That keeps staffing grounded in how the event will run, not just the guest count.
Common zones include registration/check-in, dining room/front-of-house, bar, kitchen support/back-of-house, event captain/supervisor, breakdown/strike, and, for bigger events, floater or runner roles that move where help is needed.
Here are solid starting ratios:
These numbers are a starting line, not gospel. As you run more events, swap in ratios based on your own past jobs. That’s when your staffing model starts to feel less like guesswork and more like a scalable event scheduling system.
Once you know the headcount by role, lay it against the event timeline. Staffing demand doesn’t stay flat. It comes in waves.
For many dinner events, 6:00–8:00 PM is one of the busiest windows for servers, bartenders, and kitchen staff.
Break the event into time blocks such as setup, guest arrival, cocktail hour, meal service, dessert, and breakdown. Then build shifts around those blocks instead of putting everyone on one long shift. That’s usually where labor plans go sideways: too many people standing around early, not enough hands during the rush, and tired staff at the end.
For a 150-guest event, this is a useful starting mix:
| Event Type | Servers | Bartenders | Captains | Kitchen Support | Shift Length |
|---|---|---|---|---|---|
| Wedding reception (plated) | 13–15 servers | 3–4 bartenders | 3 captains | ~9 kitchen support staff | 6 hrs |
| Corporate dinner (plated) | 10–13 servers | 3 bartenders | 2–3 captains | ~9 kitchen support staff | 6 hrs |
Treat these as planning benchmarks, not fixed rules. In your internal version of this table, add a notes column and flag details like premium open bar, multiple bar stations, or a longer breakdown window. Small details like that can swing the staffing plan more than people expect, and writing them down helps keep your ratio library sharp over time.
Many U.S. event teams use a 4-hour minimum call time. Planned shifts should top out at 8 hours, with staggered start times and a floater assigned to cover meal breaks and longer events.
From there, assign people to each zone and match staff availability to the shift windows you built. Having a plan for last-minute scheduling tools can help when availability changes unexpectedly.
Use these baseline headcounts to test peak weeks and budget limits next.
Planning one event is one thing. Planning across a full season is a different game.
Once your role counts are set, spread them across the calendar so you can see where demand stacks up and where your team starts to feel thin.
Start with 12–24 months of event history. Group it by week and month, then total your events, guest counts, and labor hours by role.
Patterns usually show up fast. May through October accounts for roughly 70–80% of U.S. weddings. On top of that, September and October alone represent close to one-third of annual wedding volume. Then the calendar flips, and corporate holiday parties and galas create another surge in November and December.
Now compare those peaks with your tracked staff availability. If a given week needs more servers, bartenders, captains, or support staff than you can field, that week is a staffing gap. And it’s better to spot that now than when the calls and texts start flying.
Outdoor events need another layer of planning. Heat, cold, rain, and wind can all change staffing needs. A nice evening wedding can suddenly need extra hands for coat check, tent support, heaters, or weather-related setup changes. Having an event day checklist helps ensure your team is ready for these shifts.
Once you know when demand climbs, the next step is figuring out how much each booking can drift from the original plan.
Forecasts almost never land perfectly. Tentative bookings stall. Cancellations come late. Guest counts jump. Sometimes a week that looked calm turns into a scramble.
That’s why it helps to build three versions of your peak-week forecast:
Then apply your role-based staffing ratios to each one. That gives you three labor-hour ranges instead of one fixed number.
That range makes planning a lot easier. You can see when it makes sense to overbook a bit, when to cross-train people, and when to keep a standby waitlist ready. A waitlist is especially useful when the forecast starts to firm up and you need to fill shifts without carrying extra fixed payroll the whole time.
A good target is to keep labor at about 25–35% of revenue, depending on the service level.
Here’s a simple example. Say your December staffing budget is $50,000, which works out to about $12,500 per week across four weeks. If one peak holiday week calls for 300 server hours at $20/hour, 150 bartender hours at $22/hour, and 80 captain hours at $25/hour, your total labor cost is $11,300. That keeps you within budget and still leaves some room for overtime or holiday pay on dates like Christmas Eve or New Year's Eve.
If that same week creeps up to $14,000, the tradeoffs are clear. You can cut headcount where service won’t slip too much, shorten selected shifts, or move some hours into lower-cost roles.
| Strategy | Cost Impact | Scheduling Complexity | Risk Reduction |
|---|---|---|---|
| Hiring early | Higher upfront | Simple | High |
| Extending shift lengths | Overtime exposure increases | Moderate | Moderate |
| Building waitlists | Lower fixed cost | High | High |
| Cross-training staff | Training investment upfront | Moderate | High |
Turn those weekly demand ranges into rosters, and keep adjusting them as bookings and availability shift.
Turn your forecast into a weekly roster, then keep adjusting it as bookings and staff availability move around.
Use the role ratios and peak-week ranges from the earlier steps to map out the week. Review upcoming events every week and list each one with its date, time window, venue, guest count, event type, service style, special requirements, and contract status.
Then sort events into three groups:
Confirmed events are your base staffing need. Likely and tentative events help you see where demand could jump.
After that, run a gap check by role. Add up the total hours needed for each role across the week. Then compare that with the staff capacity you have available. Review the numbers by role and by day so you can spot shortages before they turn into chaos.
Put the highest-risk events at the top of the list, especially ones with:
Color-code what’s covered and what isn’t. That makes weak spots easy to see at a glance. Try to publish rosters 2–3 weeks in advance so staff have time to plan, then tighten them up each week as bookings and availability shift. That gap check becomes the starting point for the roster.
Start with the roles you can’t afford to get wrong and the events most likely to go sideways. Assign experienced captains and lead bartenders first. Then fill in the rest.
Stagger start times so setup crews, peak-service staff, and teardown teams are working only when needed. That keeps labor tighter and avoids having people stand around waiting for the busy window to hit.
For large or more complex events, schedule one floater. It’s a lot better than scrambling for backup at the last minute.
Once the roster is in draft form, keep event details and staffing updates in one place. Quickstaff centralizes event details, availability, and waitlists, so roster changes stay fast. Each event record can hold role-based headcounts, shift windows, venue details, client notes, and expected guest count. From there, you can check availability before sending invites, use waitlists for busy dates, and send confirmations, call times, and last-minute updates straight to staff on mobile.
Quickstaff keeps event details, availability, and waitlists in one place, so roster changes stay fast.
Once a shift is accepted, staff can see the details they need, like dress code, parking, and event notes, without the usual back-and-forth. If a booking changes or someone drops a shift, update the record, notify the staff affected, and pull from the waitlist instead of rebuilding the whole schedule.
Repeat the same process each week: collect clean event data, forecast by role, model peak weeks, and turn gaps into rosters. When you do it the same way every week, there’s less scramble and service stays protected.
Forecast event staffing as early as you can. Start with past event patterns to build a baseline, then keep fine-tuning that plan as the event gets closer and staff availability or planning assumptions shift.
In practice, booking staff with less than two weeks’ notice can push labor costs up by 20–30%. So it’s smart to lock in staffing before that point and keep updating the plan all the way to go-live.
Build a 10–20% contingency buffer into your budget and staffing plan. That extra room helps you handle last-minute guest count changes without scrambling.
It also helps to cross-train team members for more than one role. If attendance shifts at the last minute, you can move people where they’re needed most.
Using a roster generator? Update assignments as soon as changes come in. That makes it much easier to catch coverage gaps or double-bookings before the event starts.
Calculate your utilization rate by dividing scheduled staff by your total available pool.
A rate of 70% to 85% is the sweet spot. Once you get above 90%, your team is usually stretched thin, and open shifts become much more likely.
Use Quickstaff to track availability and blocked-out dates. Then review role requirements and leave requests to catch any unfilled shifts.