Ultimate Guide to Scheduling Metrics
April 24, 2026


Scheduling metrics are tools that help event managers measure and improve staff efficiency, resource use, and cost control. By tracking metrics like staff utilization rate, shift fill rate, and labor cost per event, you can identify inefficiencies, prevent staffing issues, and optimize event operations. This is a core component of scalable event scheduling.
Advanced techniques like analyzing patterns, forecasting staffing needs, and evaluating retention metrics offer deeper insights. Using scheduling software simplifies tracking, reduces errors, and centralizes data for better decision-making.
Bottom Line: Scheduling metrics reduce guesswork, improve team efficiency, and help events run smoothly.

Key Event Scheduling Metrics: Targets and Benchmarks
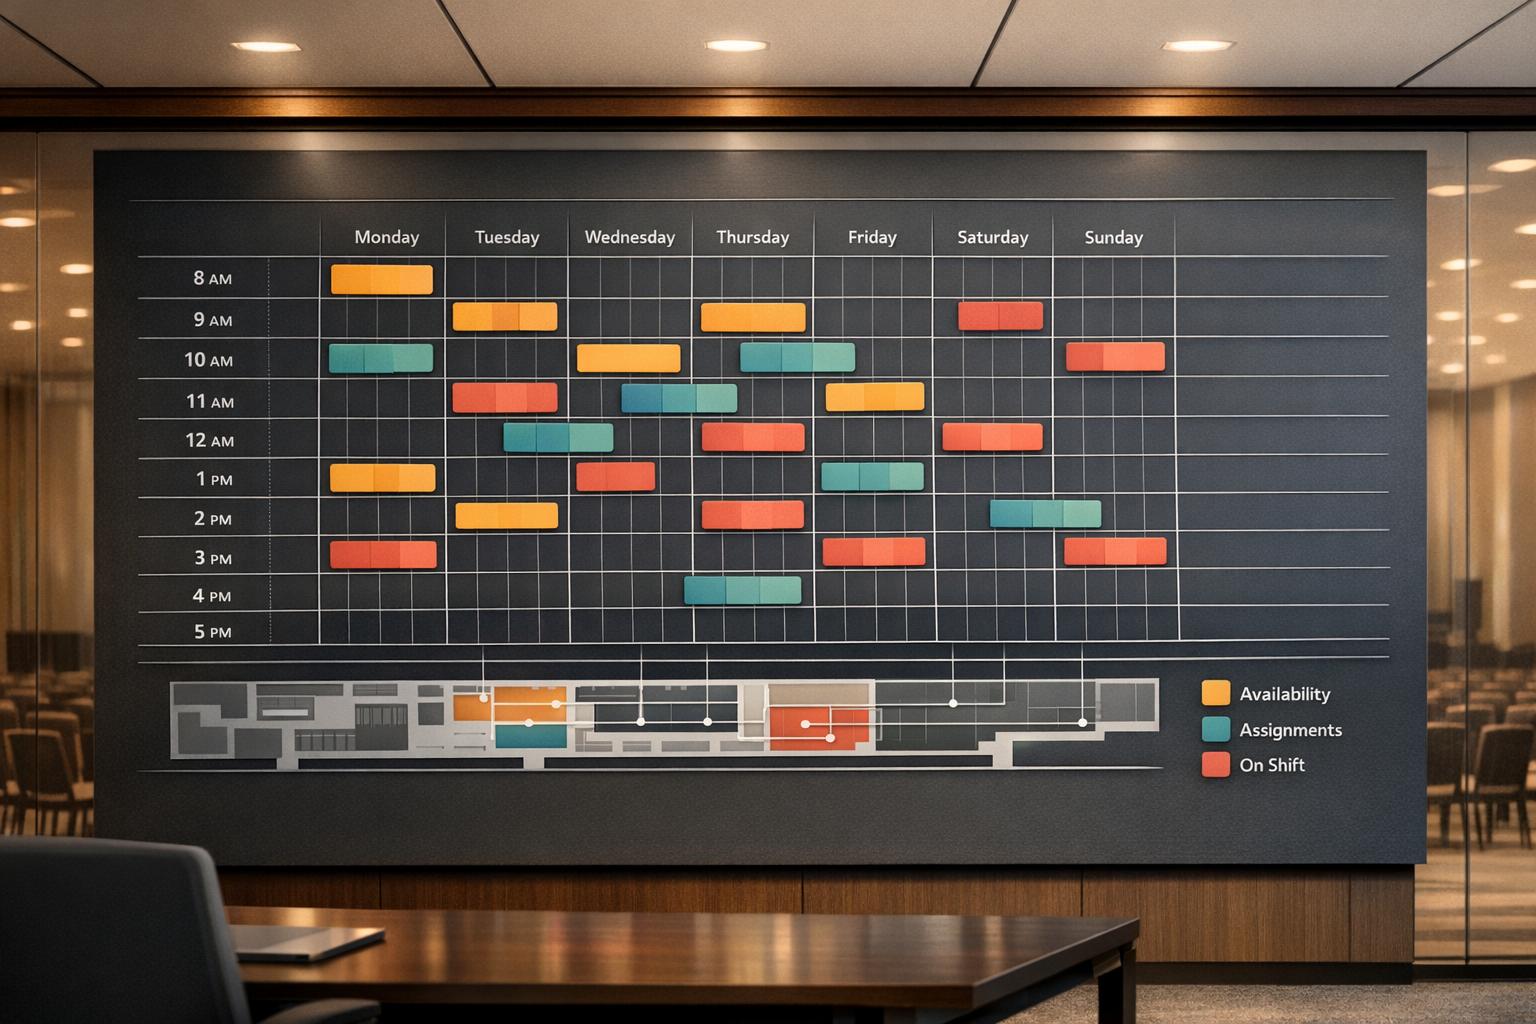
Tracking the right metrics can make a big difference in how effectively you manage your event staff. These metrics offer clear insights into resource use, shift coverage, and overall cost control.
This metric measures how much of your available staff is actively scheduled for events. It’s a great way to check if you’re using your team efficiently or leaving some potential untapped.
To calculate, divide the number of scheduled staff by the total available staff, then multiply by 100 to get a percentage. For instance, if you have 50 staff members available and 40 are scheduled for events this week, your utilization rate would be 80%.
A good balance? Many event businesses aim for a rate between 70% and 85%, which ensures operational efficiency while keeping staff workloads manageable. Additionally, maintaining the right staff-to-attendee ratio is key to ensuring smooth operations and attendee support.
Shift fill rate tells you how many of your scheduled shifts are confirmed before the event. It’s a crucial metric for evaluating event readiness and how well you’re matching staff with available shifts.
To calculate, divide the number of filled shifts by the total required shifts, then multiply by 100. For example, if you need to fill 100 shifts and 85 are confirmed two days before the event, your shift fill rate is 85%.
If your fill rate is below 90%, it might signal issues like unclear shift details, poor communication, or inadequate lead time. These problems can ripple into other areas, such as slowing down attendee check-ins due to understaffed front-line teams.
Labor cost per event measures how much you’re spending on staff as a percentage of your event’s revenue. This metric is essential for staying within budget and pricing your services correctly.
To calculate, divide total labor costs (wages, taxes, and benefits) by the event's total revenue, then multiply by 100 to get a percentage. For example, if your event generates $10,000 in revenue and labor costs are $3,500, your labor cost would be 35%.
"Budget Variance... is essential for financial planning and management, helping organizers understand where costs were higher or lower than expected and why." - InEvent
Most event businesses aim to keep labor costs between 25% and 40% of revenue, though this can vary depending on the type of event. Comparing these costs to your return on investment (ROI) ensures you’re balancing expenses with profitability. Tools like centralized dashboards can help integrate scheduling and financial data, making it easier to monitor these metrics in real time.
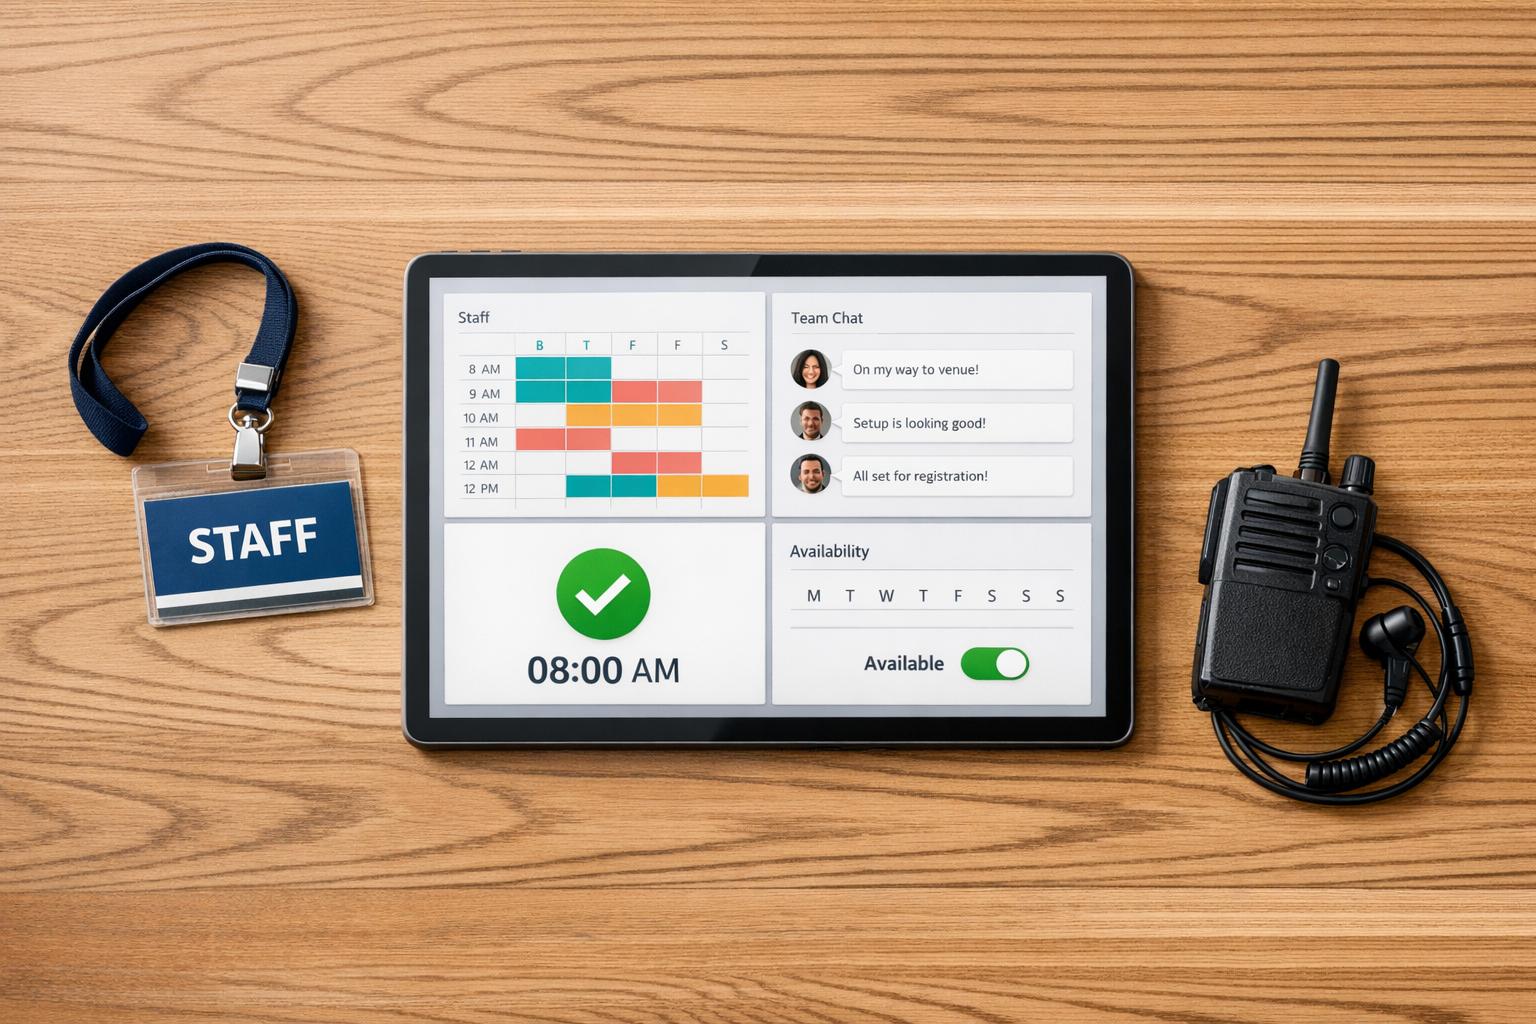
Using scheduling software like Quickstaff can simplify tracking and improve real-time adjustments for all these metrics.
Once you’ve got the basics of scheduling metrics down, the next step is diving into advanced analysis. This level of insight helps you move beyond simply tracking numbers. It’s about using data to predict challenges, adapt your strategies, and create smarter, more efficient plans for the future. These techniques can transform how you approach event planning and staffing.
Looking at historical data is one of the best ways to uncover recurring trends. By comparing key metrics across multiple events, you can figure out which staffing strategies work and which ones consistently fall short. For instance, tracking your staff-to-attendee ratio over similar events can reveal whether you’re over- or under-staffing certain types of events.
Another helpful metric is session capacity usage. If you notice certain sessions or time slots consistently reaching capacity, you can use that information to better allocate staff for future events. Automated systems can even track setup times, helping you identify which events require more labor.
"A data-driven approach refines decisions and secures event success." - InEvent
To make spotting patterns easier, consider using a centralized dashboard. Instead of juggling spreadsheets from different events, a dashboard can display key data in real time, helping you identify trends as they happen. Standardized data collection is also crucial - it ensures you’re comparing apples to apples across events.
Predictive analysis takes those past patterns and turns them into actionable forecasts. For example, time series analysis looks at your headcount trends over time to predict future staffing needs. Regression analysis, on the other hand, examines how factors like financial performance, market demand, and past staffing levels influence future requirements.
Interestingly, only 40% of companies use effective workforce forecasting tools. Yet, those that do see a 10% boost in performance speed. And there’s a major incentive for getting it right: employees with unpredictable schedules are 42% more likely to quit within six months, compared to just 24% for those with stable schedules.
AI-powered tools can process massive amounts of data, from customer behavior to seasonal trends, shifting your scheduling strategy from reactive to proactive. Start by creating a baseline for your core staffing needs. Be sure to document the assumptions behind your forecasts so you can adjust and improve them over time.
"Workforce forecasting uses data and analytics to anticipate future staffing needs." - Blaise Radley, Workday
Accurate forecasting doesn’t just prepare you for the future - it also sets the stage for addressing staff stability, which brings us to the next point.
It’s not enough to predict staffing needs; you also need to make sure your team sticks around. Retention metrics are more than just HR stats - they’re essential for smarter scheduling. High turnover forces managers to scramble to fill gaps, which disrupts schedules and creates inefficiencies. Improving retention can cut labor costs by 5–15%.
Retention metrics also help you identify scheduling issues that might be driving employees away. For example, are certain shifts or event types linked to higher turnover? Is overtime piling up on the same team members? These patterns can signal burnout, which directly impacts retention. Research shows that predictable schedules improve employee well-being, which in turn boosts retention rates.
"Scheduling instability is one of the fastest ways to push good employees out the door." - University of California's Center for WorkLife Law
Use your scheduling software’s analytics to dig into labor costs, overtime trends, and periods of frequent understaffing. This kind of data can pinpoint where your scheduling approach might be falling short. Tools like Quickstaff make it easier to track these metrics in one place, helping you address issues before they lead to staff departures.
To make scheduling metrics truly effective, they need to become a natural part of your daily operations. Here's how you can integrate them seamlessly and start seeing real results.
Relying on spreadsheets for tracking might seem straightforward, but it's prone to errors. Mistakes in data entry, misplaced communications, and uncertainty about accuracy can quickly derail your efforts. Scheduling software takes the guesswork out of the equation by automating data entry and reducing errors, saving both time and effort.
Modern platforms bring everything - registration, ticketing, staff scheduling, and attendee tracking - into one centralized system. This eliminates repetitive data entry and ensures that real-time updates are always at your fingertips. Whether it’s checking equipment availability, monitoring staff schedules, or tracking budget expenses, these tools help you adapt to last-minute changes smoothly. Features like automated reminders and push notifications ensure everyone stays updated without the need for constant follow-ups.
For example, platforms like Quickstaff simplify the technical side of scheduling. QR code check-ins replace manual attendance tracking, ensuring precise data on shift fulfillment and punctuality. Custom reporting tools provide insights into staffing levels, total hours worked, and team performance across events. Self-service portals allow team members and stakeholders to communicate their needs directly, cutting down on administrative back-and-forth. This results in cleaner data, faster decisions, and fewer errors.
By streamlining data collection and improving communication, technology becomes a key ally in making your scheduling process more efficient.
While technology handles data, your team holds the key to insights that numbers alone can't provide. Staff members are often the first to notice recurring issues - like understaffed shifts or scheduling hiccups - and their feedback can highlight areas for improvement that might otherwise go unnoticed.
To ensure effective communication, stick to a single platform - whether it’s Slack, WhatsApp, or built-in messaging within your scheduling software. This keeps all updates and adjustments in one place, making it easier to track patterns and address issues as they arise. Real-time feedback from your team allows you to resolve challenges before they escalate.
"Flexibility is not a loss of control. It's just being ready to pivot when something doesn't go as planned."
- Nathan B. Weller, The Events Calendar
Post-event evaluations are another critical opportunity to gather feedback. Ask your team what worked well, what didn’t, and where they felt stretched too thin. This kind of input adds context to your scheduling metrics, helping you make more informed decisions.
Utilizing insights from both data and team feedback, regular reviews of your metrics ensure they stay aligned with your goals. Metrics aren’t static - they need to evolve as your priorities and operations change. What’s relevant today might not be six months from now, so consistent assessment is essential.
Real-time monitoring of metrics like registration and attendance is crucial for smooth event execution. However, periodic strategic reviews give you the chance to step back and evaluate whether your metrics are still serving their purpose. Leadership and stakeholders should use these reviews to ensure metrics remain a tool for driving success.
"Review metrics regularly to make sure they're still relevant."
- Coursera Staff
Conduct formal evaluations after each event to compare actual performance against your plans. Automated dashboards can help you monitor metrics in real time, reducing the reliance on delayed manual reports. And once a metric has served its purpose, don’t hesitate to retire or adjust it.
"Stop using metrics when you've achieved the goals they pertain to."
- Coursera Staff
Breaking the review process into phases - pre-event, event day, and post-event - can help you focus on the right metrics at the right time. This phased approach adds accountability and ensures you’re measuring what truly matters. Additionally, keeping a contingency fund of 10–20% of your total budget can help cover unexpected scheduling costs revealed by your metrics.
Scheduling metrics are your go-to tools for proving the success of your event strategy and showing stakeholders measurable results.
"Hard numbers help you demonstrate the value of your event. After all, when the boss asks how your event went, simply saying 'Great!' won't cut it." - Jaime Marchwinski, Product Marketing Manager at The Events Calendar.
The key metrics we’ve discussed - staff utilization rate, shift fill rate, and labor cost per event - are essential for keeping operations running smoothly. Regularly monitoring these metrics helps you spot potential problems like slow registrations, budget overspending, or staffing shortages before they spiral out of control.
By digging deeper into your data, you can uncover trends and make smarter decisions. For example, calculating your average attrition rate (1 – [total registrations / total attendees]) helps you fine-tune catering and staffing for future events, saving money and cutting waste. In short, past event data becomes your roadmap for planning even better events down the line.
Using these insights as a foundation, switching to automated scheduling takes your efficiency to the next level.
Turning insights into action means embracing automation. Automated scheduling platforms offer real-time updates, detailed reporting, and a centralized hub for all stakeholders.
The right technology makes metric tracking much easier, but implementation matters. Tools like Quickstaff streamline event management by combining attendance tracking, scheduling, and communication in one place. This frees you up to focus on strategic decisions rather than juggling spreadsheets. Start with the metrics that are most important for your operation, use the right tools to track them, and let the data guide your next steps toward more streamlined and profitable events.
Pick benchmarks that tie directly to your event goals and give you clear indicators of success. A good starting point is to dive into your historical data - look at things like attendance numbers or revenue from past events to establish a baseline.
Next, stack those numbers against industry standards or metrics from similar events. This comparison helps you see where you stand. The key is to zero in on benchmarks that align with your objectives. For example, if your goal is profitability, focus on metrics like revenue growth or cost per attendee. If you're aiming for engagement, track things like attendee interactions or social media activity.
By honing in on these specific indicators, you'll not only measure success more effectively but also pinpoint areas where you can improve.
If your shift fill rate drops below 90%, it’s time to take action. Start by automating the job-matching process using real-time availability data. This ensures that open shifts are quickly paired with the right staff. You can also use push notifications to instantly alert employees about available shifts, making it easier for them to respond.
Don’t forget to regularly monitor and analyze your scheduling metrics. This helps pinpoint where issues might be occurring, allowing you to make precise adjustments. Additionally, workforce management tools can simplify scheduling tasks and play a key role in improving your fill rate.
To plan staffing requirements effectively, leverage predictive analytics to review historical event data and identify trends. This method uses statistical models and machine learning to anticipate future staffing needs. By taking a proactive approach to adjust staffing levels, you can reduce the risks of being under- or over-staffed and make sure the right team members are ready for upcoming events.