Long-Term Staff Retention Checklist
September 24, 2026

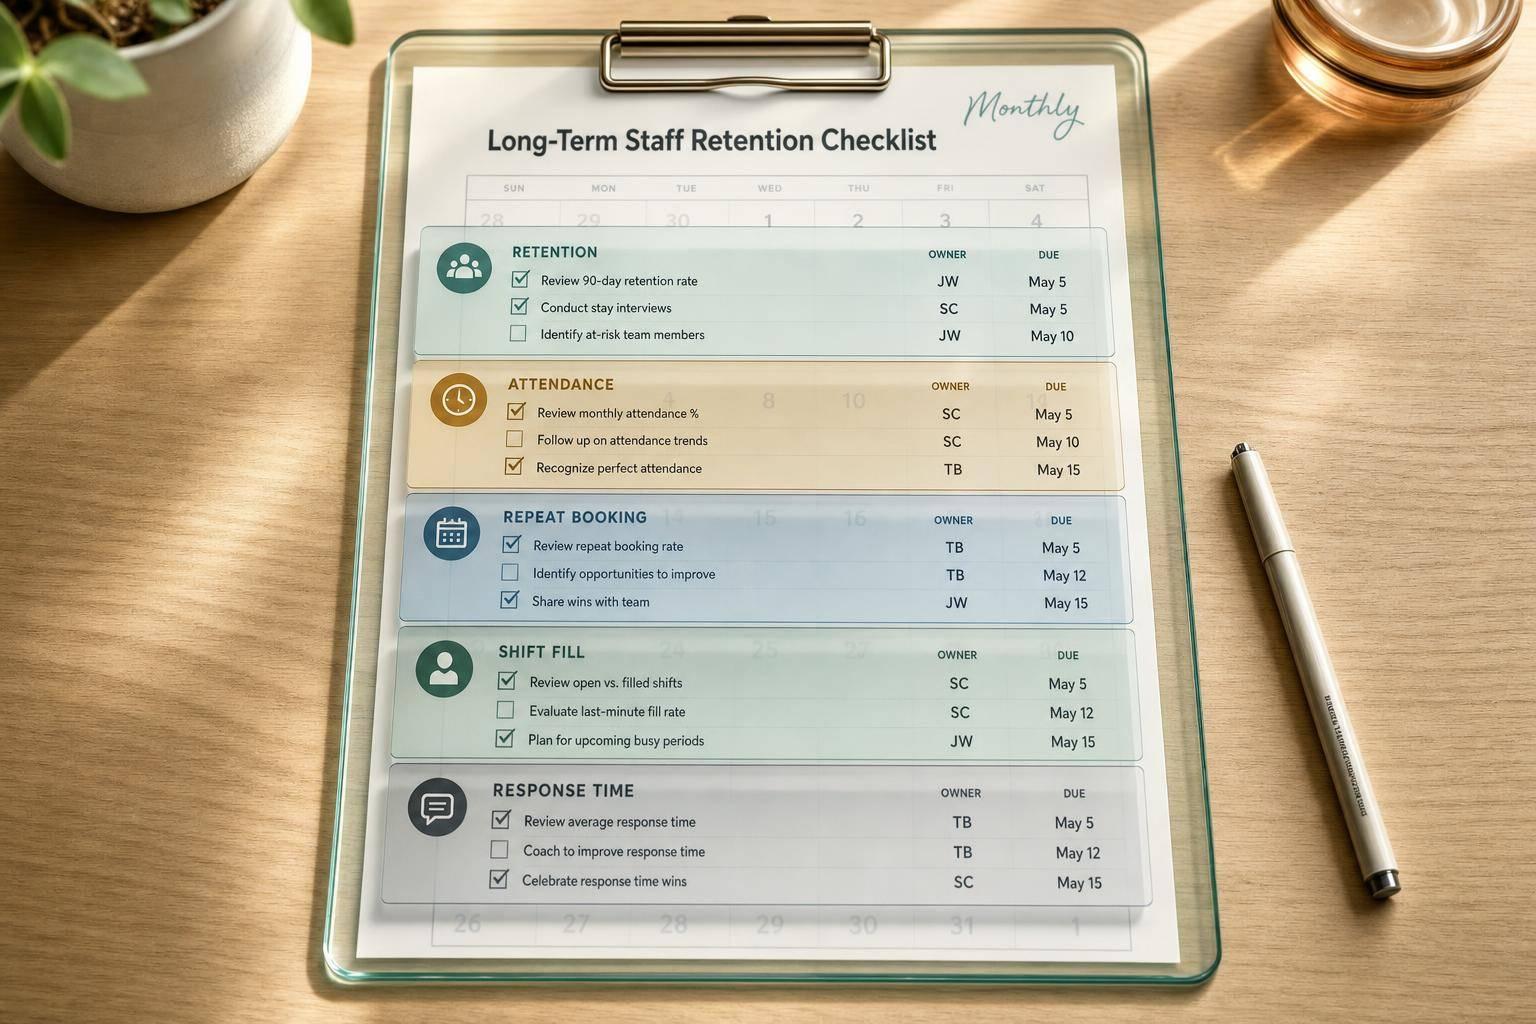
If I want to keep dependable staff, I need to review the same five numbers on a set schedule and act on problems before they turn into open shifts.
Here’s the short version: I set a fixed monthly or quarterly review period, track who stayed active, check attendance, measure repeat booking, watch fill trouble by shift type, and monitor reply times. Then I assign one owner, one action, and one deadline for the top issues.
At a glance, this checklist helps me:
A few numbers from the article make the point fast:
Quick comparison
| Area I review | What I look for | What it tells me |
|---|---|---|
| Retention | Active staff at start vs. end | Who stayed and who dropped out |
| Attendance | No-shows, lateness, same-day cancellations, swaps | Who is dependable and where problems repeat |
| Repeat booking | Eligible, offered, accepted, completed next shift | Whether staff are drifting away or just not getting offers |
| Shift fill | Fill time, declines, waitlist use, replacements | Which shifts push staffing strain |
| Response time | Time to reply or confirm changes | Whether communication is slowing booking |
This article is not about making reports for the sake of it. It’s about using a short review routine to keep good people working, cut avoidable turnover, and lower last-minute scheduling pressure.
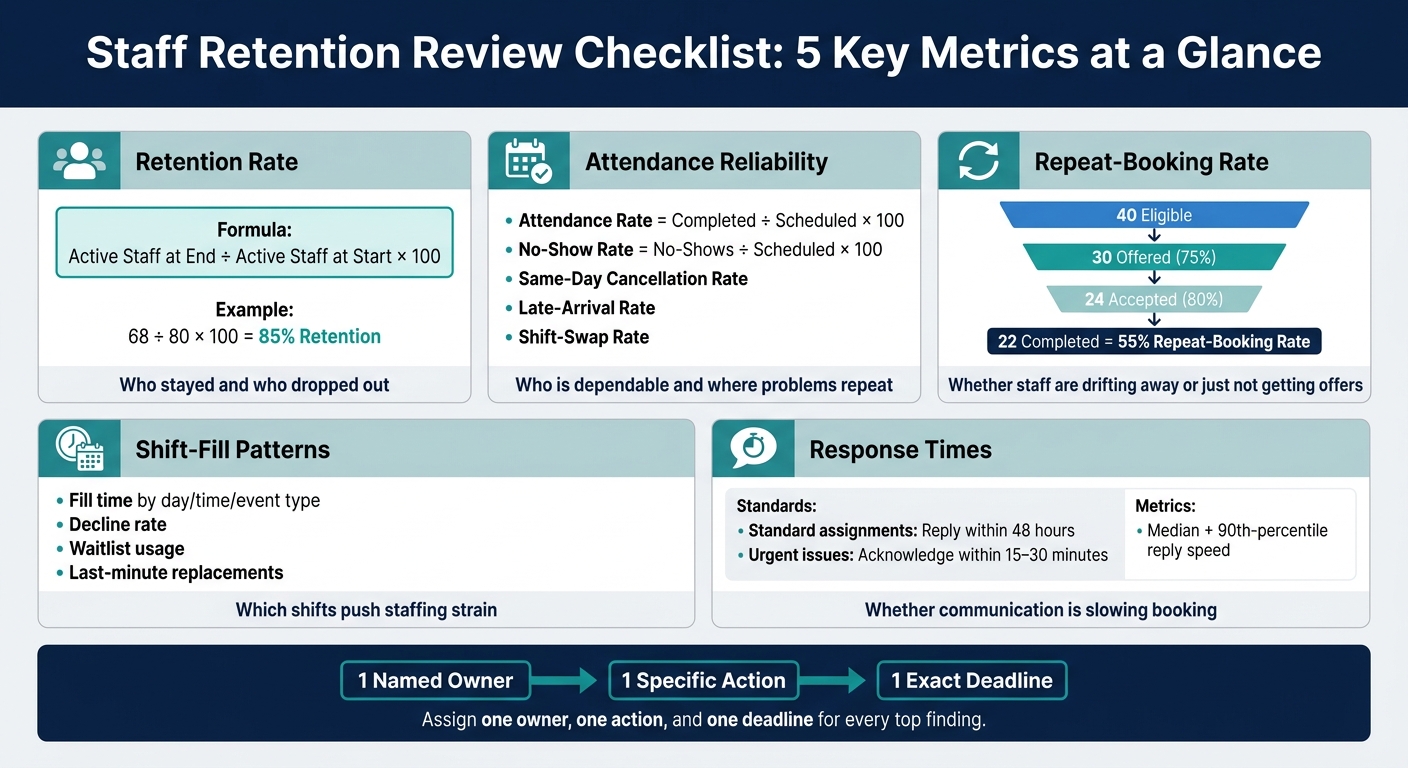
Staff Retention Review Checklist: 5 Key Metrics at a Glance
Attendance reliability and future acceptance tell you two different things. A worker can show up every time and still be drifting away. That’s why it helps to review both signals side by side instead of treating them as the same issue.
Use attendance data and repeat-booking data to see who may be at risk of dropping out and where teams may need follow-up. After that, look at the schedule itself to see where staffing gaps keep showing up.
For each worker in the review period, compare scheduled shifts with completed shifts and label every result: completed, no-show, late arrival, same-day cancellation, early departure, or approved swap. Then calculate these quick rates:
| Metric | Formula |
|---|---|
| Attendance rate | Completed shifts ÷ scheduled shifts × 100 |
| No-show rate | No-shows ÷ scheduled shifts × 100 |
| Same-day cancellation rate | Same-day cancellations ÷ scheduled shifts × 100 |
| Late-arrival rate | Late arrivals ÷ completed shifts × 100 |
| Shift-swap rate | Worker-requested swaps ÷ scheduled shifts × 100 |
Leave manager-canceled events and approved leave out of reliability calculations, but still track them separately. Frequent schedule changes can still push people out over time. Also, check both the raw count and the rate before you decide there’s a problem. A worker with one issue in two shifts is very different from a worker with one issue in 40.
When something goes wrong, record the cause: emergency, transportation issue, unclear instructions, scheduling conflict, client or venue problem, or policy violation. Often, these issues stem from gaps in onboarding new event staff properly. Stick to what’s documented. Don’t guess at intent.
This is where patterns start to matter. If issues cluster around certain venues, start times, event types, roles, pay rates, notice periods, or clients, the root cause may sit with operations, not the worker. In plain terms, the system may be creating the miss.
When workers are dependable, give them preferred access to suitable assignments, a thank-you, or public recognition with consent. If issues keep repeating, handle them in private, document the conversation, and apply your attendance policy the same way each time.
Next, look at whether those dependable workers are actually being offered repeat work.
A low repeat-booking rate doesn’t always mean workers have checked out. Sometimes they just never got a suitable offer in the first place.
Track the full offer-to-completion path for every eligible worker:
Repeat-booking rate = eligible workers who completed another assignment ÷ eligible workers in the review period × 100
A low repeat-booking rate can point to weak follow-up, poor offer quality, or low acceptance. It’s not always a disengagement issue.
Here’s a simple example. If 40 workers completed an initial event, 30 received suitable offers, 24 accepted, and 22 completed the next shift, the repeat-booking rate is 55%, the offer rate is 75%, and the acceptance rate among those offered is 80%. That split gives you a much clearer read on where things are slipping - outreach, offer quality, or follow-through.
Break results out by pay rate, shift length, notice period, venue, client, and time of day. If rates drop for a certain role, shift, venue, or client, that usually points to a scheduling or working-conditions issue.
Workers who stop getting offers and workers who stop accepting offers are not the same case. They need different retention responses. And if dependable workers aren’t coming back, the issue is often timing, pay, or fit - not loyalty alone.
Use these patterns to see where staffing starts to crack, then review which shifts stay hardest to fill and which staff respond the slowest.
Attendance and repeat-booking data show who stays engaged. Shift-fill and response times show where scheduling still drives people away.
Use attendance and repeat-booking data to check whether retention risk is starting to show up as open-shift pressure.
For each open shift in the review period, record when it was posted, how many staff were invited, how many replied, how long it took to fill, how many declined, whether a waitlist was used, and whether a last-minute replacement was needed. Then break those results out by weekday vs. weekend, morning vs. late night, event type, location, season, and holiday periods such as weddings, corporate events, and festivals.
Treat these gaps as scheduling signals first, then retention signals.
| Shift-fill signal | Likely retention risk | Manager action |
|---|---|---|
| Shifts posted late and filled only after repeated follow-ups | Staff pull back when they can't plan with enough notice | Set posting deadlines; collect availability ahead of time |
| Low acceptance for one venue or event type | Staff pull back due to commute, workload, or unclear roles | Gather targeted feedback; review venue conditions |
| High decline rate for late-night, holiday, or early-morning shifts | Hours clash with personal schedules or feel underpaid | Offer opt-in scheduling; rotate unpopular shifts; review pay |
| Fast acceptance but poor show-up rate | Staff may double-book or not have clear event details | Confirm details, send reminders, clarify cancellation rules |
| Fill time worsens quarter over quarter | Staff pull back when confirmations are unclear or conditions slip | Compare pay, notice period, and event conditions; assign a corrective action |
A repeat fill problem is both an operations issue and a retention warning. If the same shift category keeps falling short, the problem may be the scheduling setup, not the workforce.
Once you know what fills, look at how fast staff reply.
Track invitation-to-response, schedule-change-to-confirmation, and staffing-issue-to-acknowledgment. Use median and 90th-percentile times.
Set internal service targets. For example, require a confirmation or decline within 48 hours for standard assignments and acknowledgment of an urgent issue within 15–30 minutes, then adjust those targets based on event risk and local policy. Use a 48-hour confirmation window, one follow-up, then contact backups.
Every booking invitation and schedule change should include the following in standard U.S. format:
Centralized tools make these reviews faster and easier to act on.
Quickstaff makes event staff scheduling quick and easy by centralizing event details, availability, reminders, and waitlists so open shifts reach the right staff fast.
After each review period, focus on the two or three findings most likely to move attendance, repeat-booking, fill rate, or response time. Start with the biggest gaps in those four areas and use them to decide what to fix next. Don’t try to fix everything at once.
For each of the top three findings, write down one specific action, assign one named owner, and set one exact deadline. That matters more than it sounds. When ownership is shared too loosely, nobody feels fully on the hook.
Keep the action concrete, not vague. For example: "send recurring wedding offers 14 days in advance" or "match banquet servers only to roles they have already covered." Then tie that action to a measurable result, such as raise the repeat-booking rate for trained banquet servers from 45% to 60% by the December 2026 review, or reduce median response time for open shifts from 8 hours to 3 hours within six weeks.
Some fixes sit with managers. Others need sign-off from ownership, finance, or HR. If that’s the case, note the dependency and add the approval deadline too.
| Review finding | Corrective action example | Target result example |
|---|---|---|
| Late cancellations | Clarify cancellation rules in writing; confirm shifts earlier | Reduce late cancellations by 20% next quarter |
| Low repeat-booking rate | Improve role matching; prioritize proven staff for recurring events | Increase repeat bookings from 42% to 50% |
| Low fill rate | Give earlier notice; cross-train staff; expand qualified pool | Raise Saturday evening fill rate from 78% to 90% |
| Slow responses | Set a reply standard; send reminders; activate waitlist after deadline | Reduce median response time from 10 hours to 6 hours |
Then, in the next review, check whether those same metrics actually moved.
To close the loop, record what needs a second look next time. After actions are assigned, log the finding, baseline, likely cause, action, owner, deadline, target result, and review date in a simple tracker. At the next monthly or quarterly review, pull up that log first and compare the same four metrics against the earlier baseline.
Mark each action as improved, unchanged, worsened, incomplete, or inconclusive. If a metric moved the right way, see if it stayed there for more than one review period. Also check for tradeoffs. A faster response time sounds good, but not if it comes with more last-minute cancellations.
If nothing changed, don’t just run the same fix again. Rework the diagnosis first. And if a task was completed, don’t assume retention got better just because the box is checked. Check the metric.
Last piece: tell staff what’s changing, when it starts, and when they can expect an update. If a fix still needs approval or won’t begin until the next period, say that clearly.
Close the loop with the same baseline and action log from the last review. Put the checklist on a fixed monthly or quarterly schedule. When you compare the same metrics against the same baseline each time, trends start to stand out - and that gives you something concrete to act on.
Each review should look at the same five metrics, along with any open actions from the prior period. That keeps the checklist tight and centered on the same signals every cycle, instead of drifting into side issues.
At the end of each review, name:
This kind of routine cuts down on last-minute pressure and helps protect dependable staff from avoidable strain. The aim is to catch problems early, before the next event is put at risk.
Review core retention metrics monthly. Check performance KPIs more often - usually after each event or weekly.
For new hires, review progress at 30, 60, and 90 days. If you change communication or workflows, look at the impact after 60 to 90 days. Quickstaff can help by giving you one place to track attendance, shift acceptance, and engagement trends.
Start with the metrics that show how your temporary staff experience work on the ground. Those numbers tend to give you the clearest read on engagement and retention.
Begin with shift acceptance rate. Then keep an eye on no-show rate, which can point to confusion, weak communication, or low commitment. Use Quickstaff to set a baseline, then track whether updates to communication and scheduling improve results over 60 to 90 days.
If retention starts to slip while attendance stays strong, that’s often a warning sign. Your team is still showing up, so day-to-day operations may look fine on the surface. But behind the scenes, people may be checked out, worn down, or quietly looking for their next move.
That’s why it helps to look past attendance alone. Check your onboarding process, manager support, burnout risk, and engagement signals like eNPS. In Quickstaff, review repeat-booking rates and shift acceptance trends. If those numbers are dropping, it usually points to a people problem, not just a scheduling one.
At that stage, the fix usually comes back to the basics:
Small cracks can sit hidden for a while. Then people start leaving all at once.