Demand Forecasting for Smarter Staff Scheduling
September 3, 2026

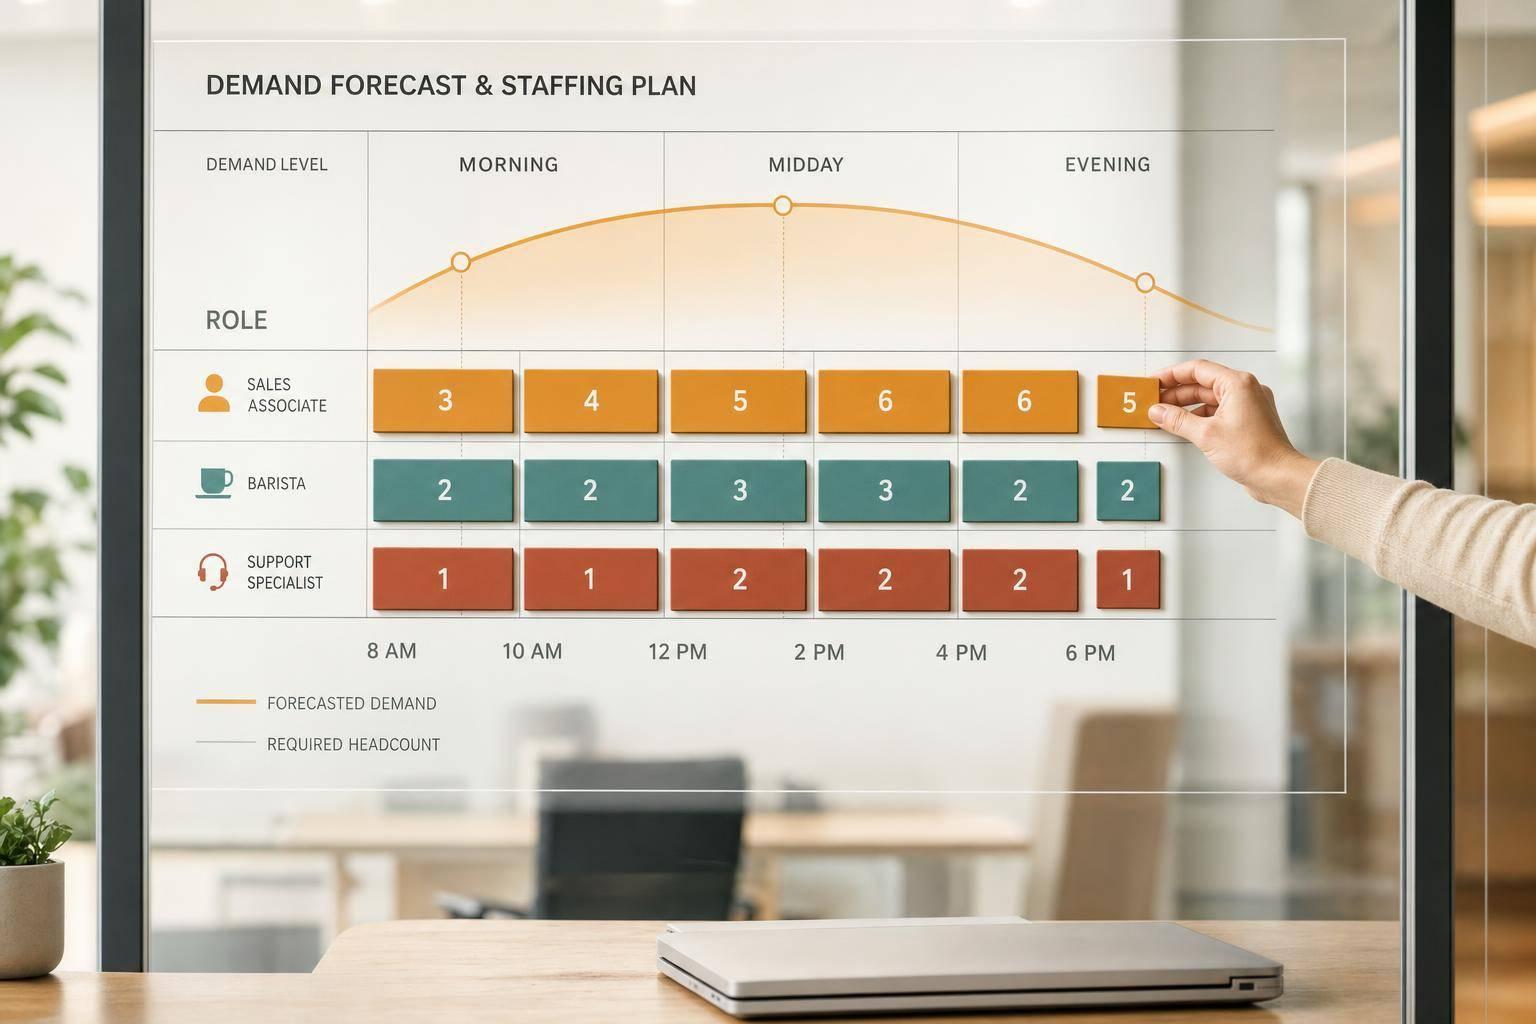
Bad staffing is expensive. If I forecast demand before I build the schedule, I can cut labor costs by 10% to 25% and reduce overtime by 15% to 30% - which matters when overtime often costs 1.5× base pay in the U.S.
Here’s the short version: I use past event data, booking changes, guest counts, seasonality, weather, and role-based labor hours to estimate how many people I need, by role and by event phase. Then I turn that forecast into shifts, track fill rate and no-shows, and update the plan at set check-ins like 7 days out, 48–72 hours out, and the morning of the event.
If I had to boil the process down, it would be this:
A few numbers shape most staffing calls:
What I like about this approach is that it replaces guesswork with a repeatable loop: forecast, schedule, check, update, and record what happened. That’s how I staff events with fewer last-minute problems and tighter labor spend.
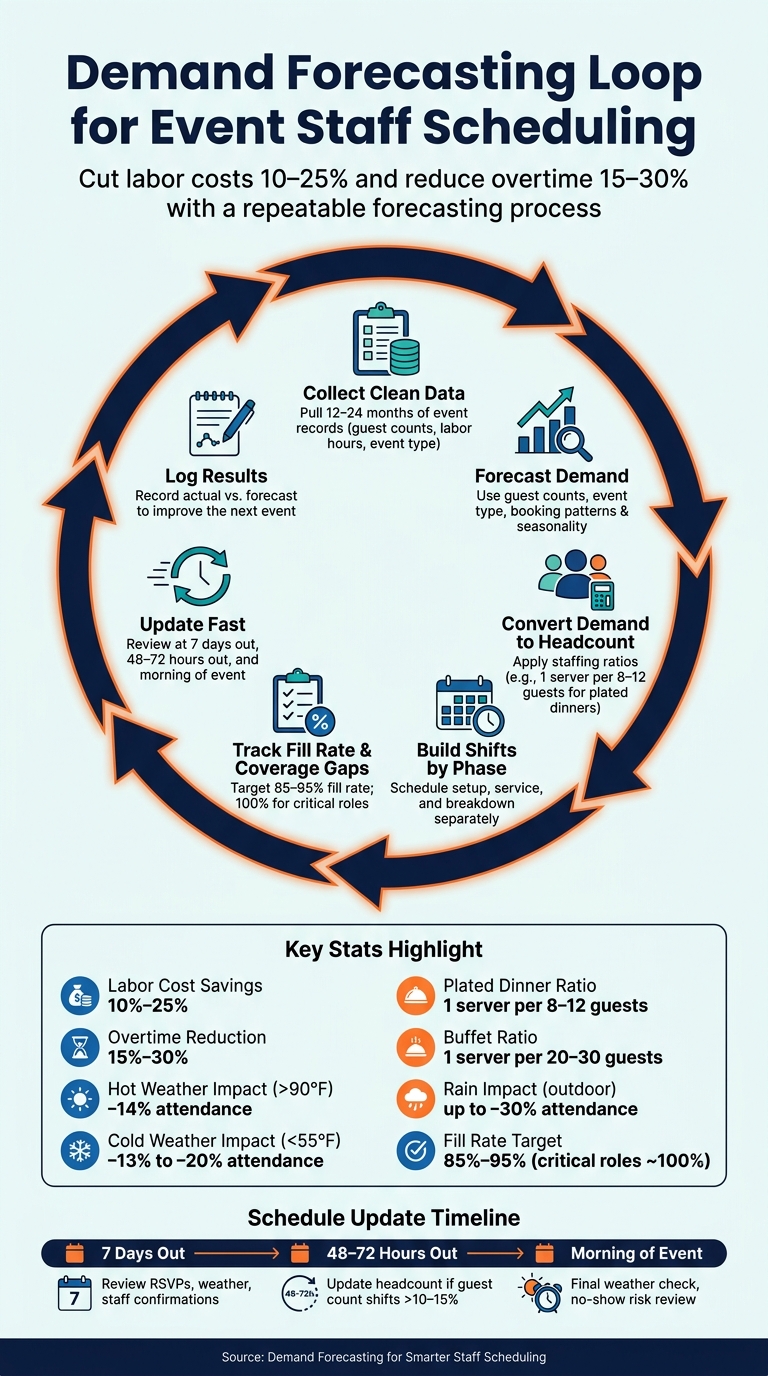
Demand Forecasting Loop for Event Staff Scheduling
Good forecasts start with clean, steady data from your booking records, timesheets, and event notes. That data is the fuel for your forecast model.
Start with your own records. Pull at least 12–24 months of past event data. Put it in one clean table so each event has its own row and the same columns every time: event date, day of week, event type, location, confirmed guest count, actual attendance, and total labor hours by role and time block, like setup, service, and breakdown.
Then look at how many events you handled by day, week, and month. That makes it much easier to spot seasonal spikes and recurring patterns. Clean up event types and role names so you’re comparing apples to apples across your history. Do the same with shift hours. If one manager logs “5 hrs” and another logs “5:00,” your data gets messy fast.
Once the data is clean, the patterns start to show up. You’ll see which event types tend to need more labor per guest, and that directly affects how many people you put on the schedule.
Your booking calendar tells you a lot about demand. Track booking lead time and guest-count changes at 30, 14, and 3 days before each event. For ticketed events, watch sales velocity too. If ticket sales jump in the final week, you may need more staff than your first estimate called for. Lead times and RSVP shifts are often what force forecast updates, so those checkpoints should be part of your workflow.
Once you track those signals, you can turn them into a headcount forecast.
Outside signals matter too. U.S. event businesses should flag federal holidays, local festivals, school graduation weekends, prom season, and major sports events on a shared calendar. Treat those dates as likely high-demand periods.
For outdoor events, weather can change both attendance and staffing needs in a hurry. One large study found that attendance peaks at 75–80°F and drops about 14% on days above 90°F and 13–20% on days below 55°F compared with mild days. For outdoor receptions and festivals, precipitation above 0.1 inches has been linked to attendance drops of up to 30%. And when attendance shifts, staffing shifts with it. You may need fewer servers, more tent setup help, or extra hands in guest flow and cleanup.
Staff required = projected demand ÷ productivity rate
Here’s the simple version: 160 guests ÷ 20 guests per server = 8 servers.
Common starting benchmarks for U.S. events include:
Bartender needs depend on bar volume and service style, so it’s best to use your own transaction data to set that number. These benchmarks are a starting point, not a rule carved in stone. Venue layout, guest mix, and service complexity can all change the math.
Use staff required = projected demand ÷ productivity rate, then run that math for setup, service, and breakdown on their own. Each phase needs its own headcount.
With clean inputs in place, the next step is picking a forecast method that turns those numbers into a working schedule. Using event staff scheduling software can help automate this transition from data to shifts.
Event businesses don’t all need the same kind of forecast. Booking patterns vary. Staffing pressure varies. So the best move is to use the simplest model that fits how your events actually run.
Start with the data you already track. Build from that. Then tighten the forecast after each event. The point isn’t to get a perfect answer on day one. It’s to build a model you can actually use for scheduling.
Use driver-based forecasting when staffing follows clear inputs like guest count, stations, or service steps. In plain English, you connect the work to the thing that drives it. If guest count goes up, service work goes up. If stations increase, staffing does too.
Tie staffing outputs - servers, bartenders, setup crew, and breakdown crew - to those inputs, then convert the workload into labor hours by role.
Run the math separately for setup, service, and breakdown. After that, fit those hours into standard 4-, 6-, or 8-hour shifts that match the event timeline.
This works best when events follow a steady format, like weddings at one venue or recurring corporate dinners. The more standardized the event, the more dependable this model gets over time. And that matters, because a forecast only helps if you can turn it into a schedule without a bunch of guesswork.
If your business runs events all year, there’s a good chance your demand already follows patterns.
Wedding season usually peaks from late spring through early fall. Holiday parties bunch up in November and December. Summer festivals tend to run from June through August.
Plot total guest counts and labor hours by month for the past 2–3 years. That makes it easier to spot which months stay busy and which ones slow down. When seasonality is stronger, one-point forecasts become less useful.
A simple way to handle that is to build three scenarios:
That gives you a staffing plan for expected demand, with room for spikes when business runs hotter than usual.
A forecast that never gets checked won’t get better.
After each event, compare the forecast with what happened: guest count, total labor hours, and hours by role. Track forecast error after every event. Aim for MAPE below 10%; 10% to 20% is workable; above 20% means the model needs revision.
Over time, those errors start to tell a story. Maybe breakdown labor keeps getting under-forecasted for large events. Maybe setup hours are fine, but bartender hours drift high at holiday parties. That’s the kind of pattern you can fix by adjusting productivity rates or widening your scenario ranges.
That’s how a rough first estimate turns into a staffing forecast you can use for the next schedule.
Once the forecast is set, turn it into shifts and measure how well the schedule fills.
Turn forecasted demand into a phase-by-phase shift plan. This is the point where a demand forecast stops being a spreadsheet and starts becoming a working schedule.
Use the forecasted guest count, role mix - the mix of servers, bartenders, captains, and support staff - and event phases to build the schedule. Break the event into clear phases: setup, guest arrival, service, turnover, and breakdown. Then use the forecasted guest count and task list to map each phase into shifts by time block and role. Size each phase by role and peak block, not by habit.
Build contiguous shifts that start 30–60 minutes before the first task. That gives staff enough runway to get set, check details, and step in ready to work. It also helps you avoid unnecessary gaps that leave people standing around or, worse, leave a phase short-staffed.
Fill rate = shifts filled ÷ shifts requested. For U.S. event businesses that rely on part-time or gig-based staff, a practical target is 85–95%. Critical roles like event captains and bartenders should be pushed as close to 100% as possible.
Track schedule adherence from check-in to check-out. When adherence stays low for the same role or time block, it usually points to one of three problems: the forecast missed the mark, the shift design didn’t fit how the event would actually run, or communication slipped before the event.
Coverage gaps show where the schedule came up short and staff did not show. Track those gaps by phase and role, not just as one overall number. That makes it much easier to see what needs fixing - whether that means changing forecast rules, tightening shift timing, or adding backup staffing for future events.
Use Quickstaff to create the event, post role-based shifts, track availability and waitlists, and update live staffing as demand changes. Mobile check-ins let the captain see staffing status in real time and catch coverage gaps early instead of finding them in the middle of service.
Save each adjustment in the event record so the next demand change is faster to handle.
Once the schedule is live, the forecast still needs attention. Think of it as a live plan, not a one-and-done estimate. Guest counts move, weather changes, and staff can cancel or fail to show. The teams that handle these bumps well usually have a simple update routine they follow every time.
Build three check-ins into every event: 7 days out, 48 to 72 hours out, and the morning of the event. At each check-in, review updated RSVPs or ticket counts, weather forecasts, and staff confirmations. If the guest count changes by more than 10–15% or by 25+ attendees, update headcount and role mix right away.
Weather should have its own trigger too. If the National Weather Service shows rain, heat above 90°F, or a sudden cold snap in the days before an outdoor event, you may need more help for coat check, tent setup, hydration stations, and guest flow. Check the forecast at the 72-hour mark and again on event morning.
For no-show risk, review staff confirmations 24–48 hours out. If key roles are still unconfirmed, act fast. Call staff directly, turn to the waitlist, or bring in a backup. Treat a 15% staffing shortfall as the point where action starts.
Once the forecast changes, staff need ONE clear version of the schedule. Every update should spell out:
Put the impact first, then explain the reason. Use one system of record for every schedule update so people aren't comparing a text message with an old spreadsheet. For any major change to time, location, or role, ask for active confirmation. If high-priority staff still haven't replied, follow up by phone. When you can, give at least 24–48 hours' notice for non-emergency changes.
After the event, close the loop with a clean record of what changed. Log the numbers that matter: actual guest turnout versus forecast, total hours worked by role and event phase, any shifts that stayed unfilled, and every schedule change made in the final 24 hours. Add a short note explaining each late change, such as a weather call, a no-show replacement, or a late VIP add-on.
It also helps to get short feedback from supervisors on whether staffing felt right, too lean, or too heavy during each phase. Those notes often catch problems the raw numbers miss. Quickstaff's centralized event records and message history make this review simple - planned and actual staffing, who confirmed and when, and what was communicated all sit in one place.
Demand forecasting for event staffing should work like a loop, not a one-off task. After each event, the same process should feed the next one. The best event teams stick with the same cycle every time: gather clean data, forecast demand, build role-based schedules, update changes fast, and feed the results into the next event.
When scheduling starts with a forecast, teams can cut labor costs and avoid staffing gaps.
Simple usually wins here. A basic rule tied to actual demand, then checked after each event, will beat a model your team can’t keep up with. Consistency matters more than complexity.
One system can make that loop easier to run day after day. Quickstaff helps keep forecasts, schedules, availability, waitlists, reminders, and staff communication in one place.
The aim is simple: give your team a process they can repeat without starting from scratch for every event. That means less scrambling, tighter labor costs, smoother events, and a better forecast next time.
Start with real-time demand signals and outside factors like local events, holidays, attendance patterns, and live customer flow. That gives you an early read on where demand may spike, so you can adjust staffing before things get hectic.
Then build a baseline with standard staffing ratios for your event type and service style. If you use Quickstaff, centralized event records can help you compare planned headcount with actual headcount and sharpen future forecasts over time.
Start with staffing ratios for your most common service models, like plated dinners or buffet service.
Then look at your own past events to fine-tune those ratios. Use details like guest counts, event types, service styles, and event length. That gives you a staffing plan based on what has actually happened, not broad guesses.
In Quickstaff, you can track utilization, attendance, and task completion to keep adjusting the mix between team output and the guest experience.
Plan to publish your initial roster two to three weeks before the event. That gives your staff enough time to sort out schedules and prepare.
Try to lock in staffing before the two-week mark. Last-minute labor can push costs up by 20–30%, and that adds up fast. After that, update the roster weekly as bookings and availability shift.
Once you get closer to the event, make changes as soon as they happen. A fast update can help you fill gaps, deal with cancellations, and keep the schedule on track.